Master Kubernetes monitoring with proven best practices that drive measurable results. Learn battle-tested strategies from industry experts on implementing monitoring solutions that scale.
As more organizations adopt Kubernetes to run their applications, monitoring has become increasingly challenging. The dynamic nature of container orchestration brings powerful capabilities but also new complexities. Traditional server monitoring approaches no longer suffice - we need methods designed specifically for distributed, container-based systems.
Container environments generate massive amounts of performance data. With pods and services constantly spinning up and down, tracking system health becomes tricky. Standard monitoring tools often can’t keep up with the granular needs of Kubernetes clusters.
Take a typical e-commerce site running on Kubernetes. You might have hundreds of containers handling different functions like payments, inventory, and user accounts. When issues arise, pinpointing the source without proper monitoring is extremely difficult.
The shift to microservices adds another layer of complexity. Modern applications consist of many small, interconnected services. This requires monitoring tools that can trace requests across components while maintaining visibility from individual containers up to overall cluster health.
Recent research shows the growing importance of effective Kubernetes monitoring. According to industry surveys, 45% of companies moved to Kubernetes seeking better performance, yet 26% struggled with inadequate monitoring capabilities. By late 2021, 77% of organizations planned to run at least half their big data workloads on Kubernetes. Learn more in this detailed report: Kubernetes Adoption Widespread for Big Data
The good news is that many powerful monitoring tools now exist specifically for container environments. Tools like Prometheus and Grafana provide the detailed insights needed for Kubernetes clusters. These solutions help teams collect key metrics, visualize data, and set up early warning systems. For more on improving your Kubernetes setup, see our guide on How to master Infrastructure as Code.
Success with Kubernetes monitoring requires using these specialized tools effectively. Focus on watching metrics at multiple levels - containers, pods, and clusters. Track important data points like resource usage, application performance, and system health. With the right monitoring approach, teams can get the most from Kubernetes while keeping their applications reliable and fast.
A well-designed data collection pipeline forms the foundation of effective Kubernetes monitoring. Getting this right means creating systems that not only gather key metrics but can also scale with your growing infrastructure while delivering meaningful insights about application health and performance.
High-cardinality metrics present a major challenge in Kubernetes environments. These metrics, which contain many unique label combinations, can quickly consume significant resources. A common example is tracking HTTP requests by IP address - this single metric could generate thousands of unique time series. To manage this effectively:
When operating multiple Kubernetes clusters, maintaining uniform data collection becomes essential. Setting up standardized monitoring configurations across all environments helps ensure you’re gathering comparable metrics that enable meaningful analysis. Configuration management tools can automate this process and maintain consistency as your infrastructure grows.
DaemonSets play a vital role in achieving reliable data collection. By running collection agents on every node in your cluster, DaemonSets ensure complete coverage of your infrastructure. This approach provides consistent monitoring of all nodes and resources throughout your Kubernetes clusters. Learn more about effective monitoring strategies in this Kubernetes Monitoring Deep Dive.
While thorough monitoring is important, it shouldn’t come at the cost of system performance. Collecting excessive data can strain both monitoring systems and application performance. Data sampling offers an effective solution - by collecting representative samples rather than every data point, you can significantly reduce data volume while maintaining valuable insights.
Metric aggregation provides another useful approach. By combining related metrics into higher-level indicators, you can reduce the total number of metrics while keeping meaningful data. For instance, instead of tracking individual pod latencies, consider monitoring average latency per service. This simplifies analysis while reducing the load on monitoring infrastructure.
Good Kubernetes monitoring requires more than just gathering numbers. The key is picking and studying metrics that give you clear insights into how well your apps are running, rather than drowning in endless data points.
Every application needs different types of monitoring. For instance, online stores need to watch things like how fast orders go through and response times. But data processing apps care more about how many tasks they can handle at once. Finding the right metrics for your specific needs is essential.
Let’s say you run an app that needs instant responses - you’ll want to track response times and error counts closely. But if you’re running batch jobs that process data in chunks, processing speed and completion rates matter more. This focused approach helps teams zero in on what really counts.
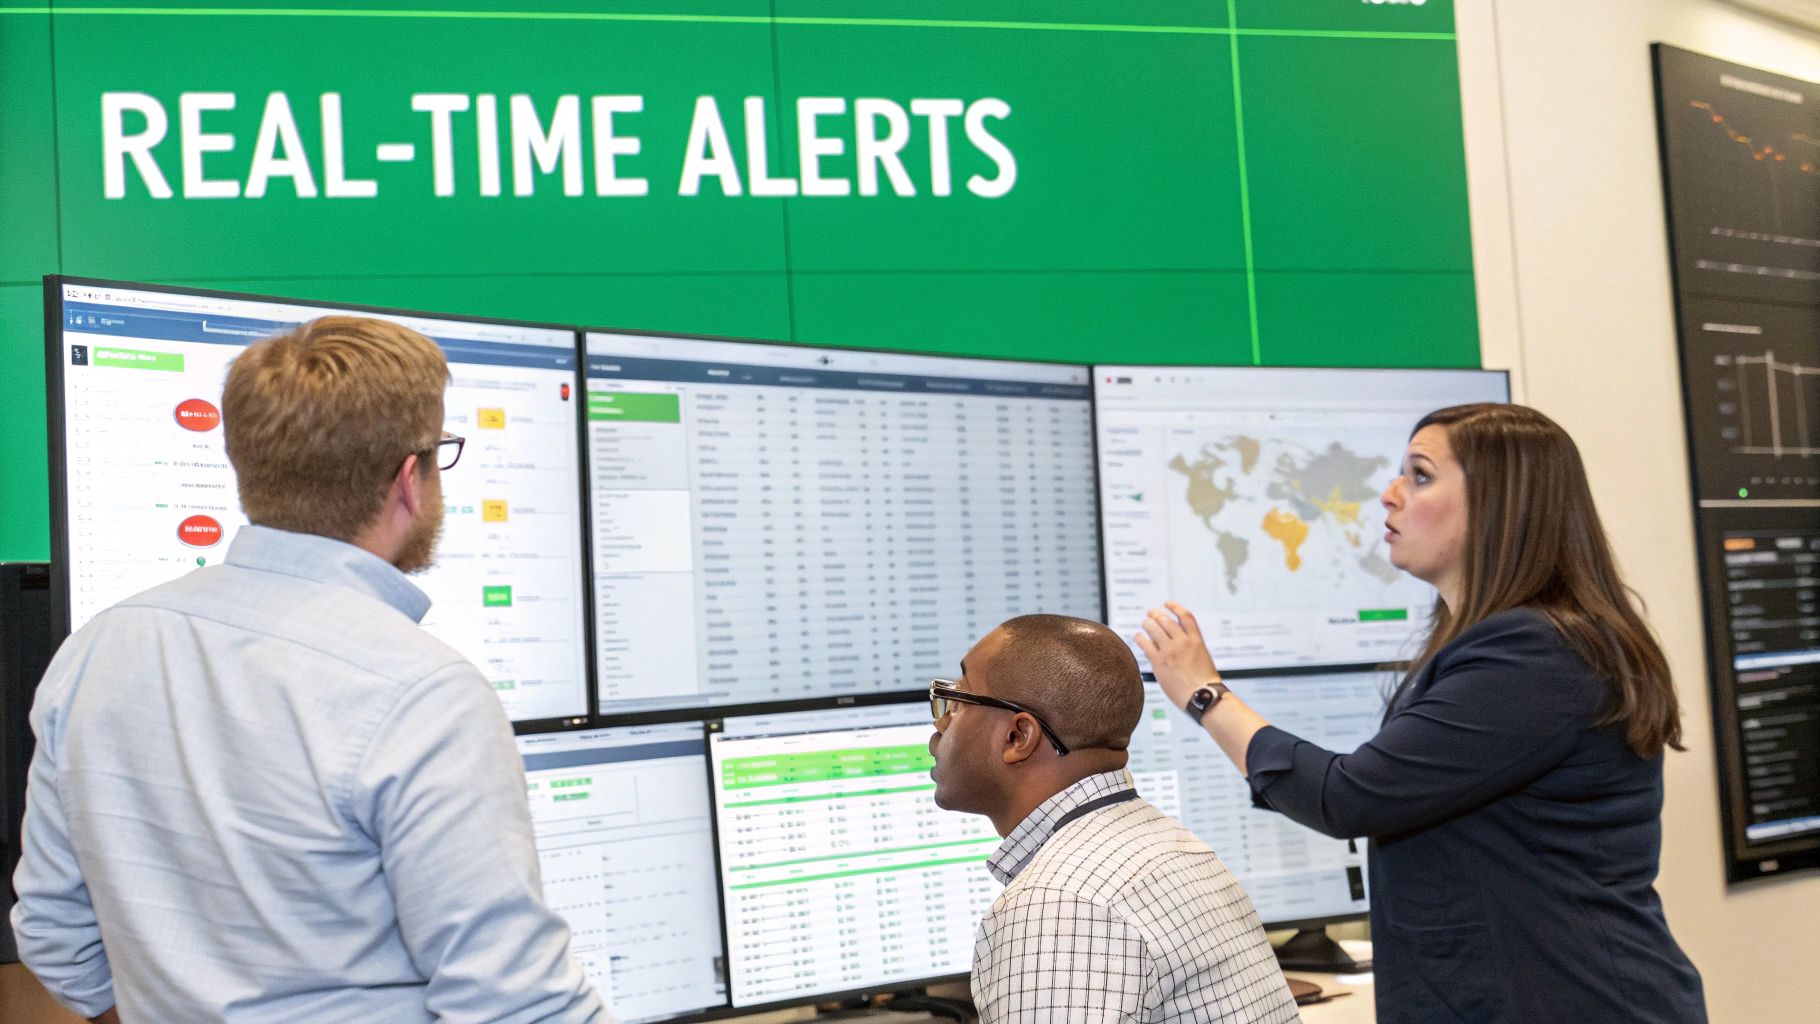
After picking your key metrics, you need to set smart alert levels. These are like warning flags that wave when something’s not right. Set them too high and you’ll miss problems; too low and you’ll get flooded with false alarms.
It helps to look at how different metrics connect. High CPU use might line up with heavy network traffic or slow database responses. Looking at these patterns together gives you the full story of what’s happening in your system. This makes it easier to find and fix the real source of problems. Want to learn more about setting up effective monitoring? Check out these Kubernetes Monitoring Best Practices.
While Kubernetes comes with useful built-in metrics, creating your own custom metrics can give you deeper understanding of your app’s behavior. This lets you track specific things that matter to your business.
Take a social media app as an example. You might create a metric that counts posts, likes, and shares per user. This gives you a clear picture of how people use your app and helps spot unusual patterns that need attention.
Kubernetes monitoring needs regular updates. As your apps grow and change, your monitoring should too. Keep checking if your metrics, alert levels, and warning systems still make sense. Get input from your development, operations, and security teams to make your monitoring better over time.
Look back at past incidents to learn what worked and what didn’t. This helps you spot potential issues before they become problems and fix things faster when they do go wrong. The result? A more reliable Kubernetes setup that keeps getting better.
Good visibility across your Kubernetes setup is essential for keeping applications running smoothly and reliably. This means watching multiple layers of your system - from individual containers up to the full cluster. Having clear insights at each level helps you quickly find and fix issues before they cascade into bigger problems.
To monitor Kubernetes effectively, you need to watch every part of your infrastructure. This includes tracking container resource usage and health status, pod communication and overall state, and cluster-level resource allocation and stability. For instance, if a container’s CPU spikes suddenly, it could point to a code problem. Similarly, pods that keep restarting might indicate network issues.
Looking at each layer separately isn’t enough - the real value comes from connecting the dots between them. When you link container metrics with pod logs and cluster events, you get the full story behind any problems. Say a container crashes - by checking its logs alongside pod events and cluster resources, you can tell if it was due to a bug, resource limits, or an external service failing. Want to learn more? Check out these Kubernetes monitoring best practices.
As your Kubernetes environment grows, your monitoring needs to keep up. Prometheus and Grafana are great tools for collecting and viewing data at scale, helping you maintain visibility even in large environments. You might also want to add distributed tracing to see how requests flow through your services, which helps spot bottlenecks and improve performance.
Microservices offer many benefits but make monitoring trickier. With lots of connected services, tracking requests and finding problem sources becomes challenging. Using service meshes like Istio or Linkerd helps by showing detailed service-to-service communication patterns. You can see traffic flows, spot slow responses, and improve how services work together. When combined with monitoring at every layer, this approach helps you manage complex systems more effectively and catch problems early.
Building an effective monitoring system for Kubernetes requires carefully selecting and combining the right tools. Rather than chasing trending solutions, focus on creating a monitoring stack that delivers clear insights for your specific needs. Understanding how different tools excel in various aspects of monitoring helps build a complete solution.
Each monitoring tool has distinct strengths. Prometheus excels at metrics collection and storage, while Grafana provides powerful data visualization capabilities. Other tools focus on distributed tracing to track requests across microservices. Choose tools that work together without duplicate functionality to keep your setup clean and cost-effective.
A practical example would be using Prometheus to gather metrics, Grafana for dashboards and alerts, and Jaeger for tracing requests. This focused combination gives you comprehensive monitoring without unnecessary overlap. When picking tools, consider factors like integration requirements, community resources, and ability to scale.
Many organizations find success mixing open-source and commercial monitoring tools. Popular open-source options like Prometheus and Grafana handle core monitoring needs effectively. Commercial tools can add specialized features and enterprise support when needed. Choose the mix that fits your team’s technical skills, budget and monitoring goals.
For example, use open-source tools to monitor infrastructure basics, then add commercial application performance monitoring (APM) for deeper application insights. This balanced approach leverages the strengths of both types of solutions.
Getting your monitoring tools to work together smoothly helps build a complete view of your Kubernetes environment. Tools like Thanos and Cortex help combine metrics from multiple Prometheus instances, enabling monitoring across large clusters.
Consider bringing all monitoring data into one platform for easier analysis. Having metrics, logs and traces in a single place makes it faster to spot issues and identify root causes. For example, Metrics Server tracks resource usage on nodes while kube-state-metrics monitors Kubernetes objects. Get more monitoring insights from this Datadog guide. Together, these tools provide clear visibility into cluster health - a key part of effective Kubernetes monitoring.
Good monitoring only becomes valuable when paired with proper alert and response systems. Your team needs to know about issues quickly and have clear steps to resolve them. This means setting up smart alerts and creating response plans that actually work during incidents.
The key to effective alerts is finding the right balance. Too many alerts cause fatigue, while missing critical issues puts systems at risk. Base your thresholds on real performance data and service-level objectives (SLOs). For example, if your app normally responds in 200ms, don’t alert at 210ms - that’s too sensitive. A 500ms threshold would better indicate real problems.
Set up different alert levels based on how serious issues are. Minor slowdowns might trigger a warning for the team to check things out. Major outages need critical alerts for immediate action. This helps your team focus on what truly needs attention.
When alerts fire, everyone needs to know what to do next. Create clear paths for who handles what and when to involve others. Give teams the right tools and info to fix problems quickly. A typical flow might start with the on-call engineer and move up to senior developers if needed.
Key elements of good response workflows:
Playbooks guide teams through different types of incidents. Keep them current as your systems change. After major problems, update the playbooks with new lessons learned. This helps teams get better at handling issues over time.
Essential playbook practices:
Ready to make your documentation process better? DocuWriter.ai helps teams create code and API docs automatically. See how DocuWriter.ai can help